Barplot inspiration

A barplot (or bar chart) is a type of chart that represents categorical data with rectangular bars. The length or height of the bar is proportional to the values they represent. Barplots are useful for comparing different categories of data.
1
Projects
Learn more about Barplot
Data To Viz
Code tutorials
RPythonD3.jsReact
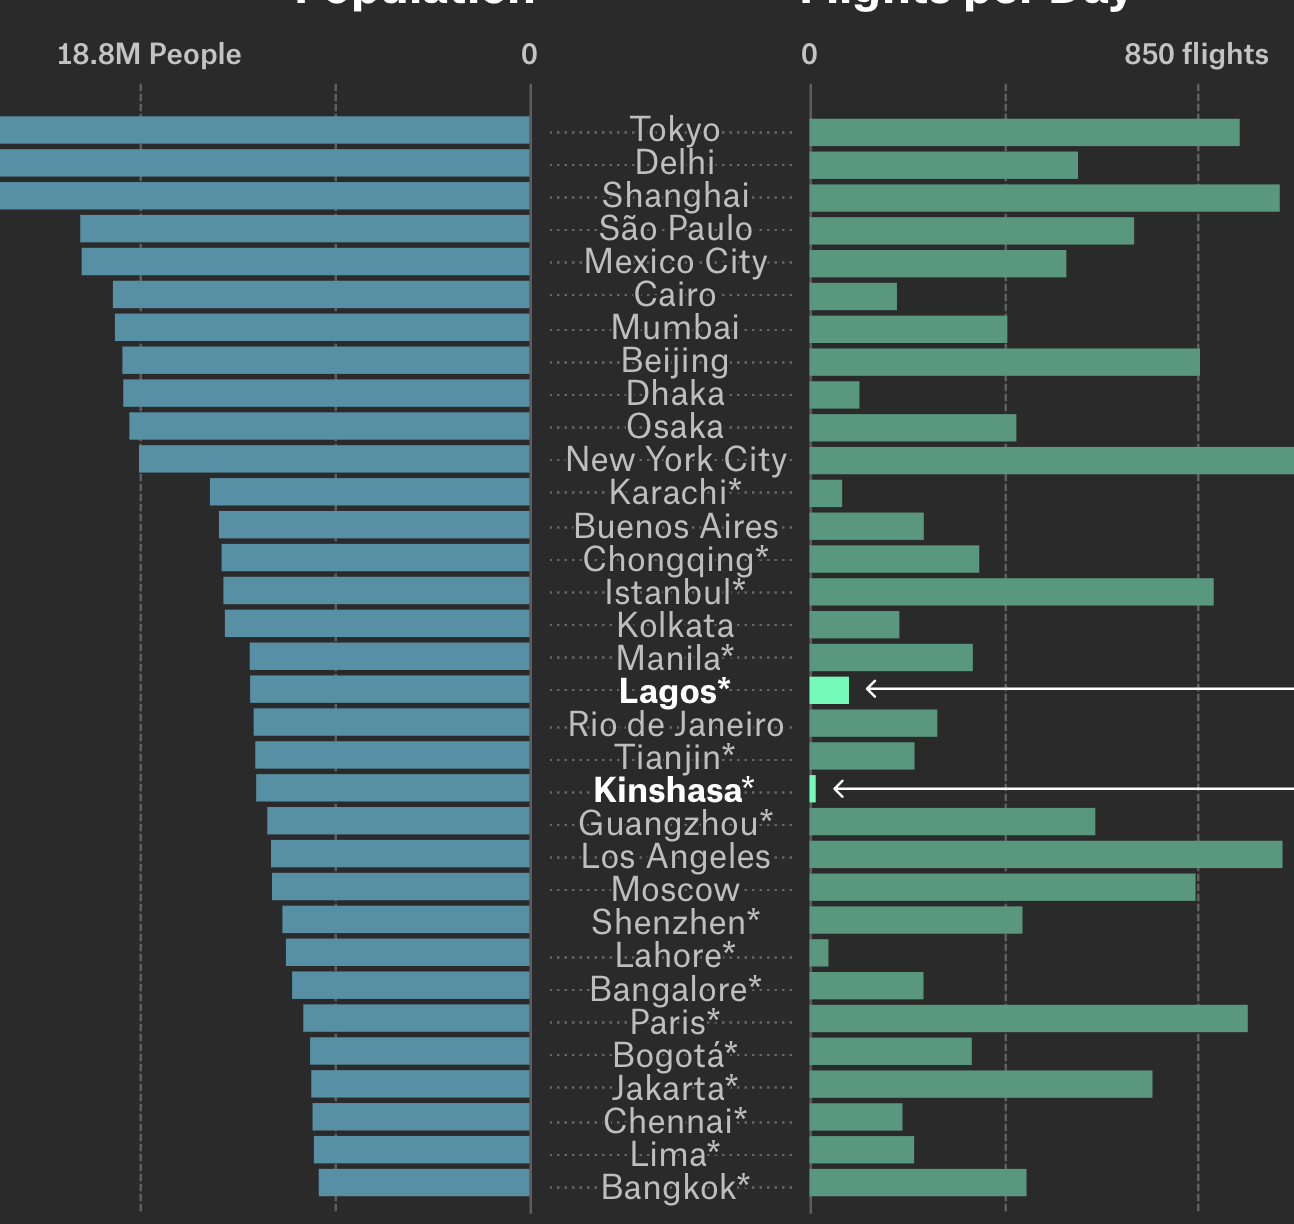
Airports and world's megacities
The Pudding
July 2018
0

League of legend analytics
Kris Akerstrom
April 2022
0

Covid 19 Dashboard - India
Group of dedicated volunteers
November 2021
0

Running stats
Unknown
October 2020
0