Bubble inspiration

A bubble plot is a variation of a scatterplot where a third dimension of the data is represented by the size of markers. It allows for the visualization of three variables in a two-dimensional space.
0
Projects
Learn more about Bubble
Data To Viz
Code tutorials
RPythonD3.jsReact
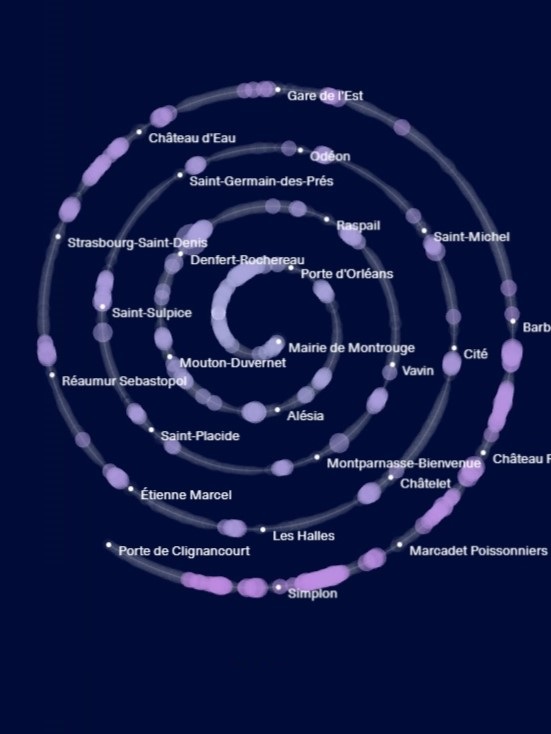
Commute noise pollution
Ludovic Riffault
November 2025
0

Searching Covid-19
Schema Design
January 1970
0
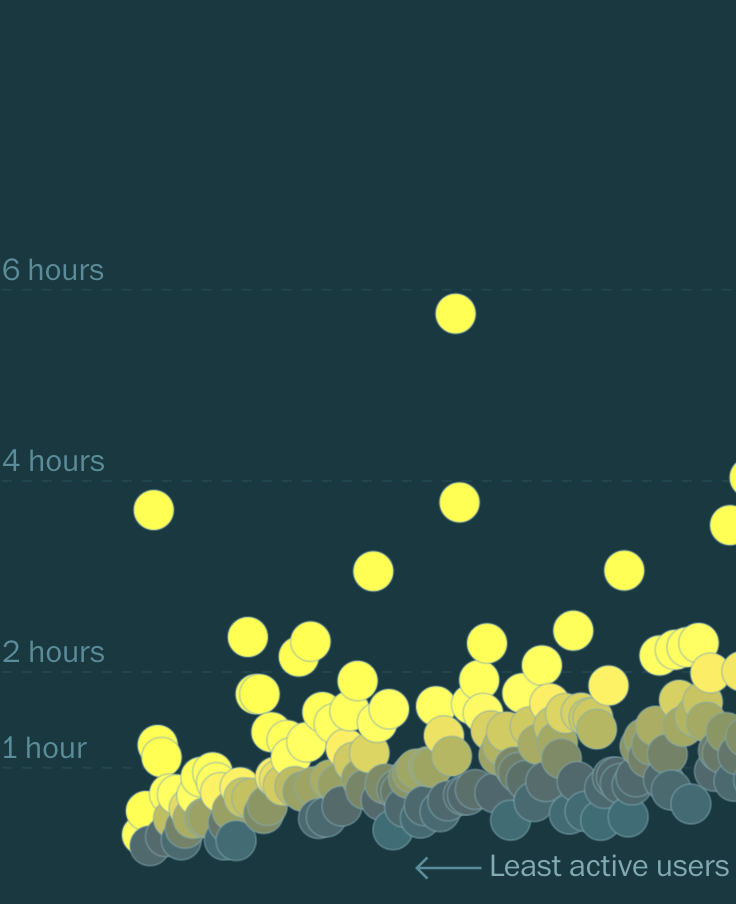
How TikTok keeps its users scrolling for hours a day
The Washington Post
November 2025
0
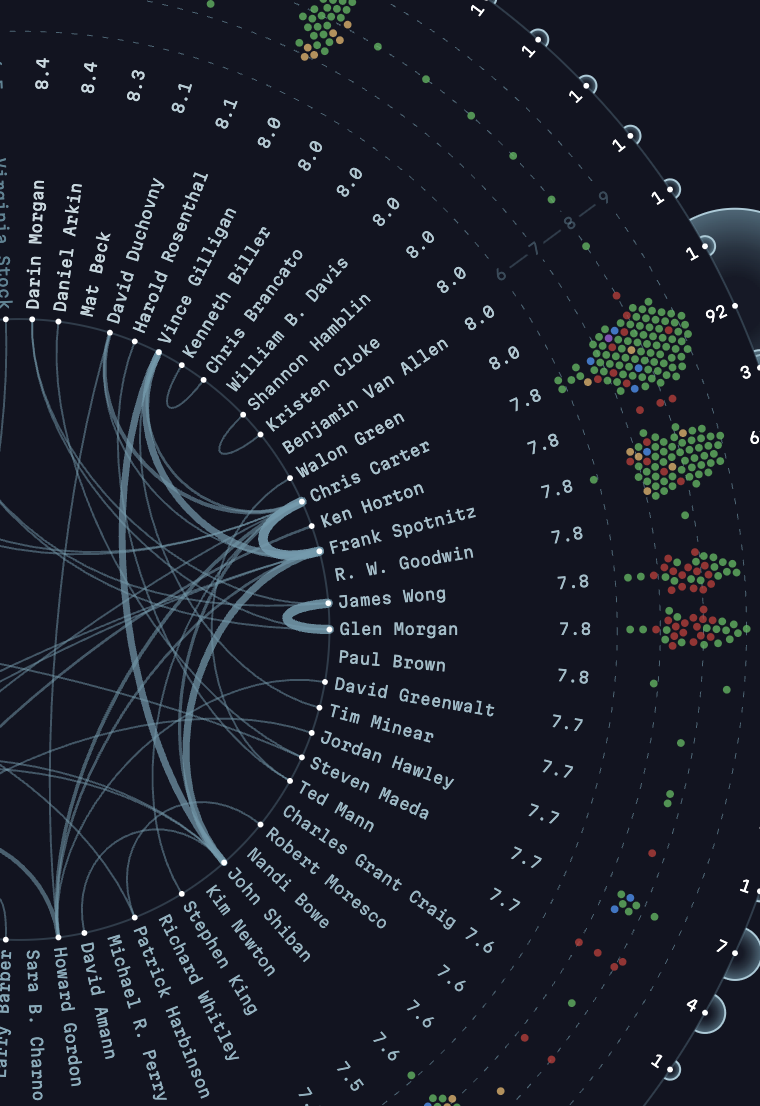
Every Writer of Chris Carter's TV Shows
Ihar Yanouski
November 2025
0

Color Dodge
Dmitry Novikov
June 2022
0
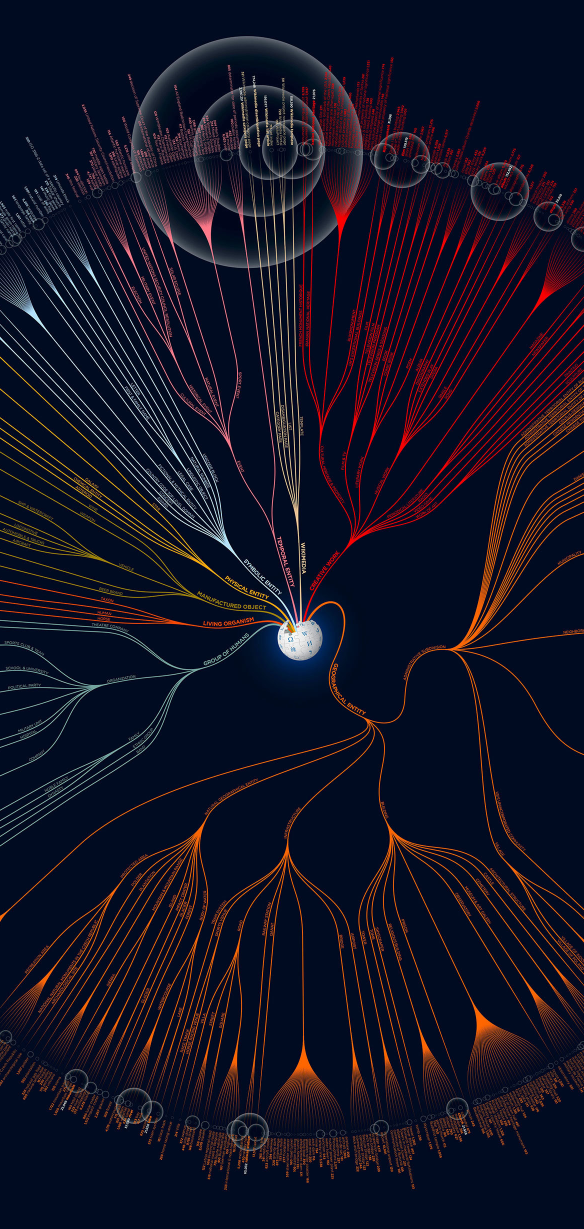
What is Wikipedia about?
Ask Media
June 2014
0

Plastic waste
Lisa Hornung
July 2022
0