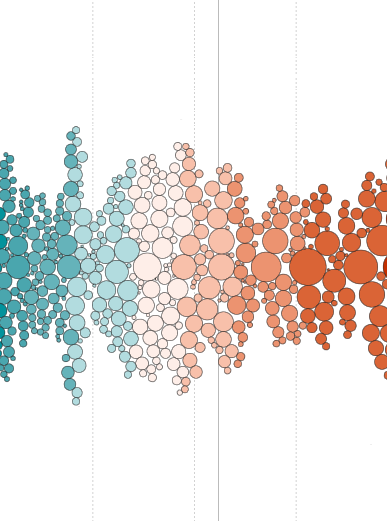
Bubble inspiration

A bubble plot is a variation of a scatterplot where a third dimension of the data is represented by the size of markers. It allows for the visualization of three variables in a two-dimensional space.
Projects
Learn more about Bubble
Code tutorials
Bruxelles Malade
Catherine Joie et al.
June 2022

Plastic waste
Lisa Hornung
July 2022
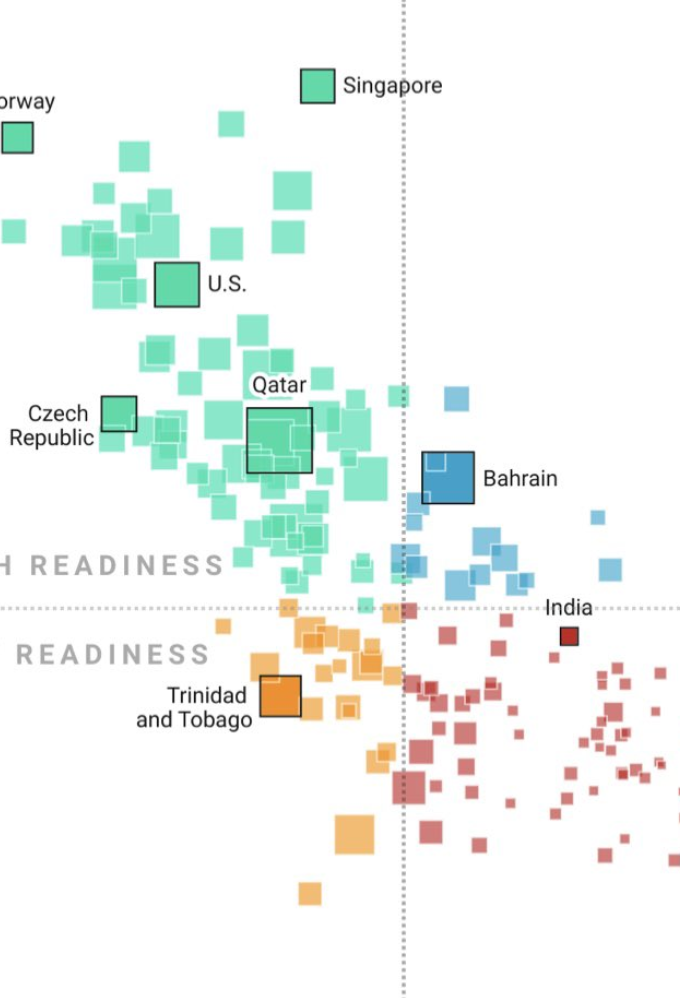
Climate change: vulnerability and co2
David Wendler
September 2022
All you need is love
Robert Janezic
November 2022

Chinese repression via Twitter
Tom Février
January 2023

Commute noise pollution
Ludovic Riffault
April 2025

A day in the life of Americans
Nathan Yau
April 2025

Rappers, Sorted by Size of Vocabulary
Matthew Daniels
January 2019

Piano Notes
Alice Feng
March 2022
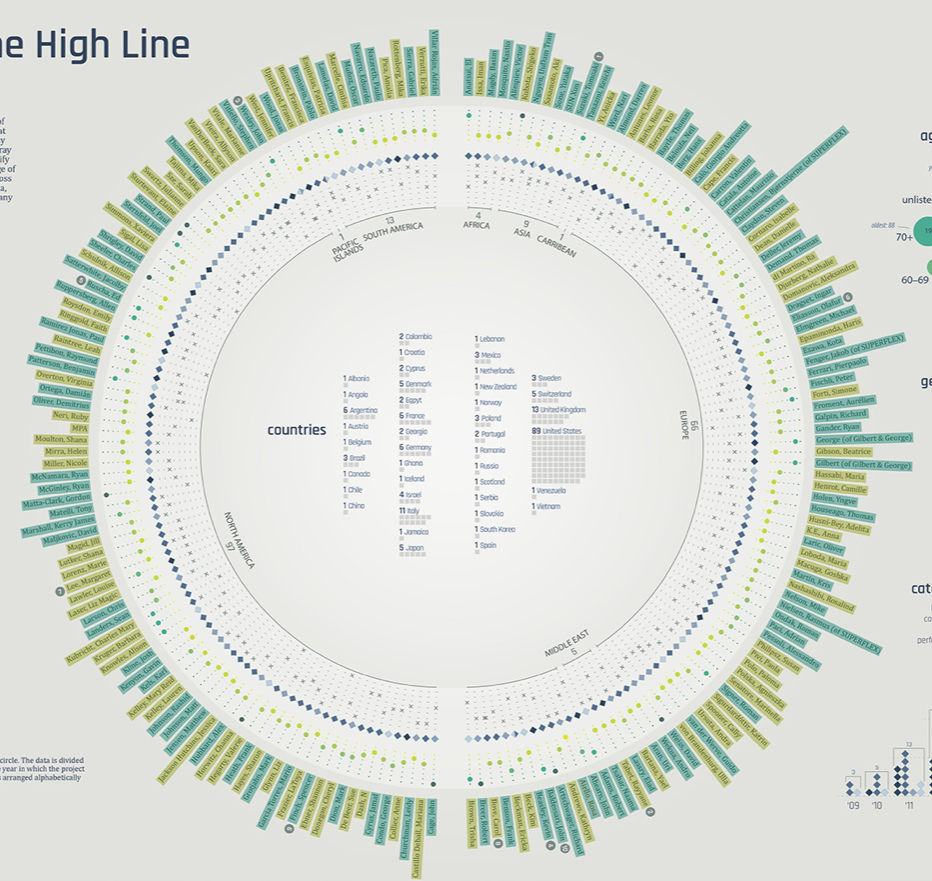
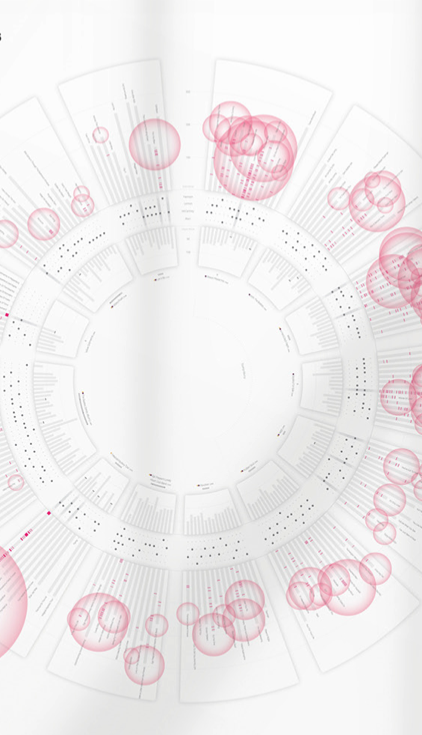
The Art of the High Line
Studio Terp
March 2016

Datylon
Datylon
May 2022