Line chart inspiration

A line chart displays information as a series of data points (markers) connected by straight line segments. It is useful for showing trends over time or relationships between variables.
Projects
Learn more about Line chart
Code tutorials

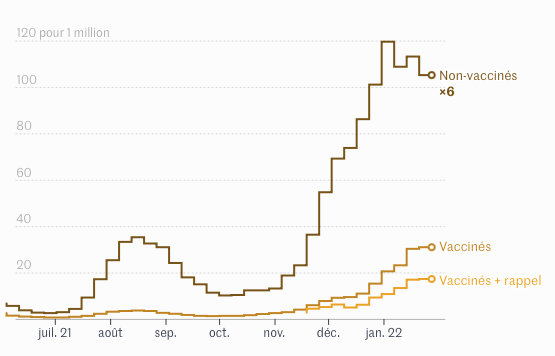
Hong Kong and the Omicron variant
the Financial Times
March 2022

Child Labour
The Economist
August 2021

Running stats
Unknown
October 2020
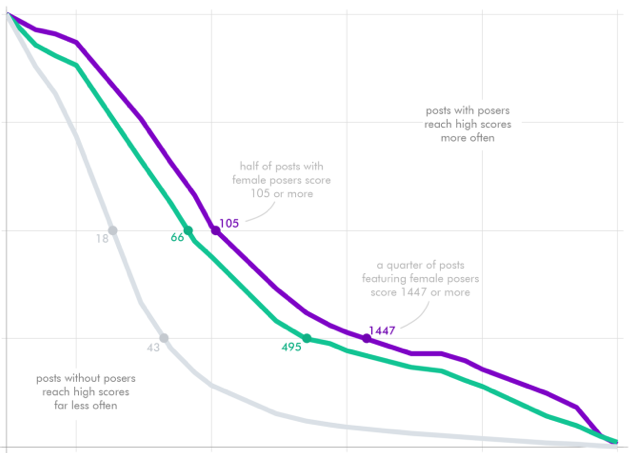
Art, Women posing and upvotes
Erin
June 2021
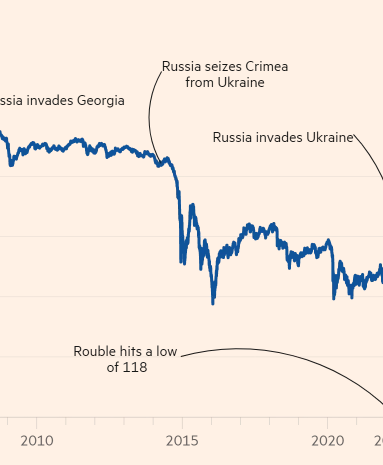
Rouble tumbles to record low
The New York Times
February 2022

Decline in sex
Washington Post
April 2019
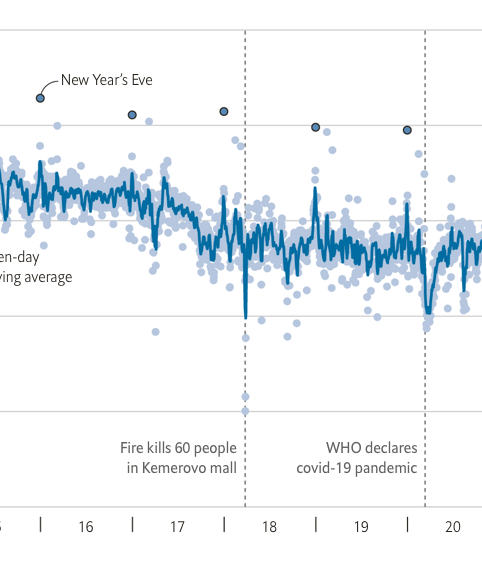
Sentiment in Russian tweets
The Economist
March 2022

Cat rescues by the London fire brigade
Georgios Karamanis
March 2021

Nobels, no degrees
G. Lupi, S. Quadri, G. Rossi, D. Ciuffi, F. Fragapane, F. Majno
November 2012
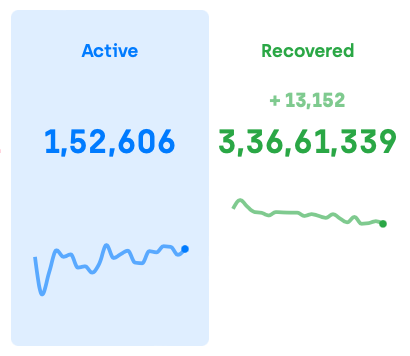
Covid 19 Dashboard - India
Group of dedicated volunteers
November 2021
Covid dashboard
Le Monde
February 2021

Big mac price
Cédric Scherer
March 2021