Streamgraph inspiration

A streamgraph is a type of stacked area graph that displays changes in quantitative data over time. It is useful for visualizing trends and patterns, especially when dealing with multiple categories or data series.
Projects
Learn more about Streamgraph
Code tutorials
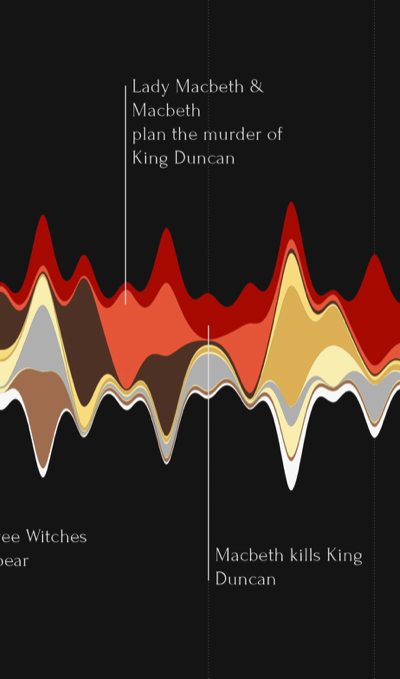
Who speaks when in Shakespeare's MacBeth?
Ansgar Wolsing
April 2022
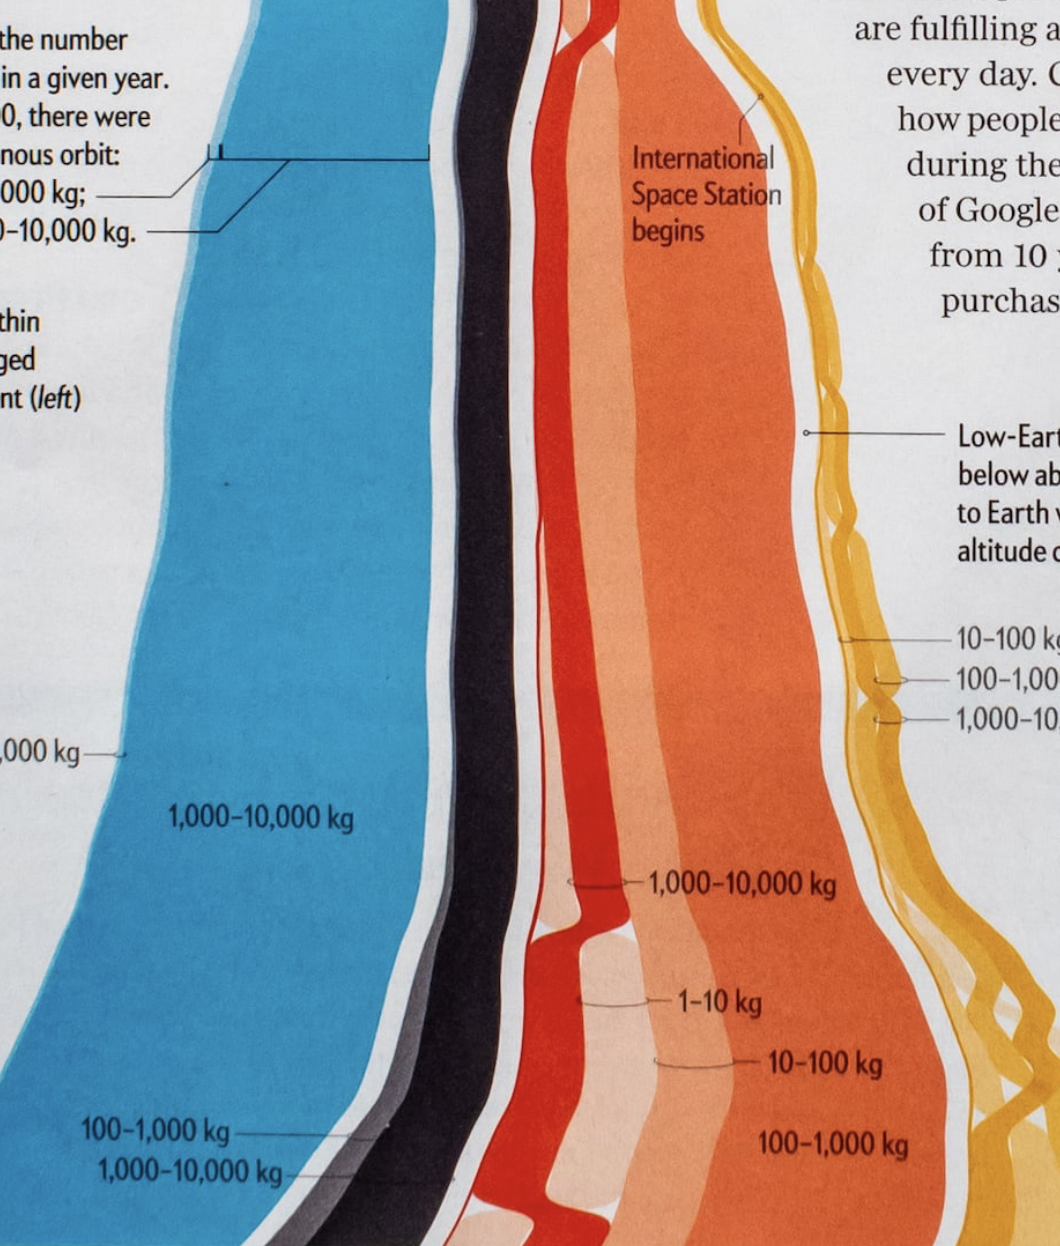
Satellite Surge
Nadieh Bremer
February 2020

Datylon
Datylon
May 2022
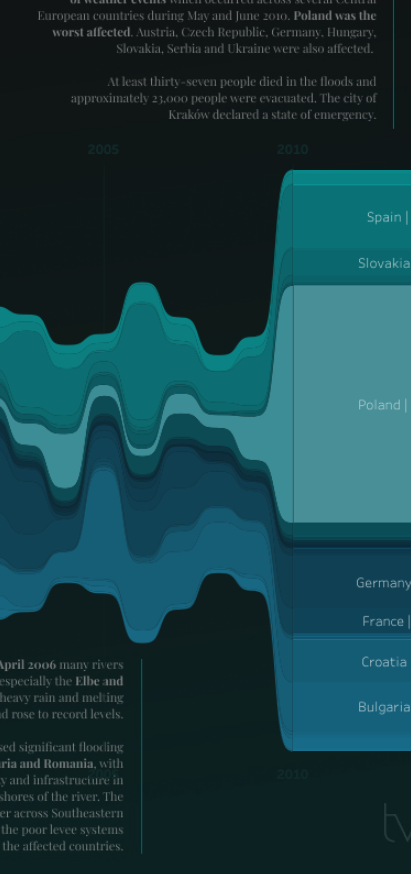
Flood Phenomena
Tamás Varga
September 2020

Endangered languages
Nature
September 2020

Ebb & Flow
Robert Janezic
November 2022
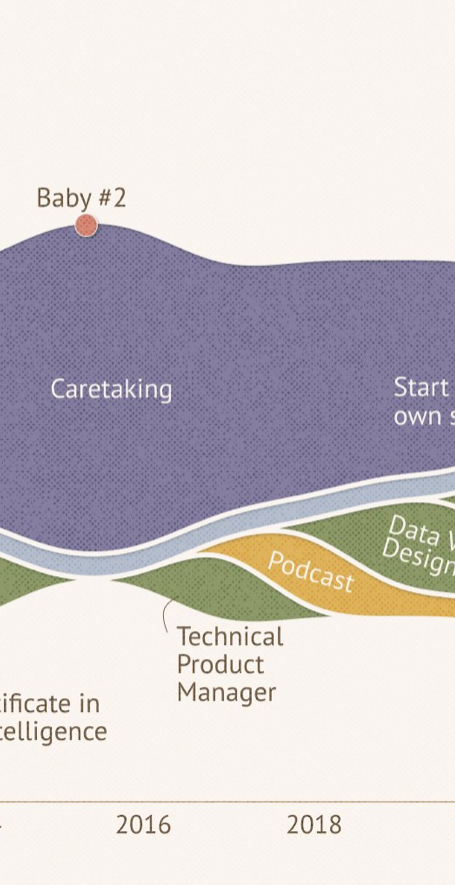
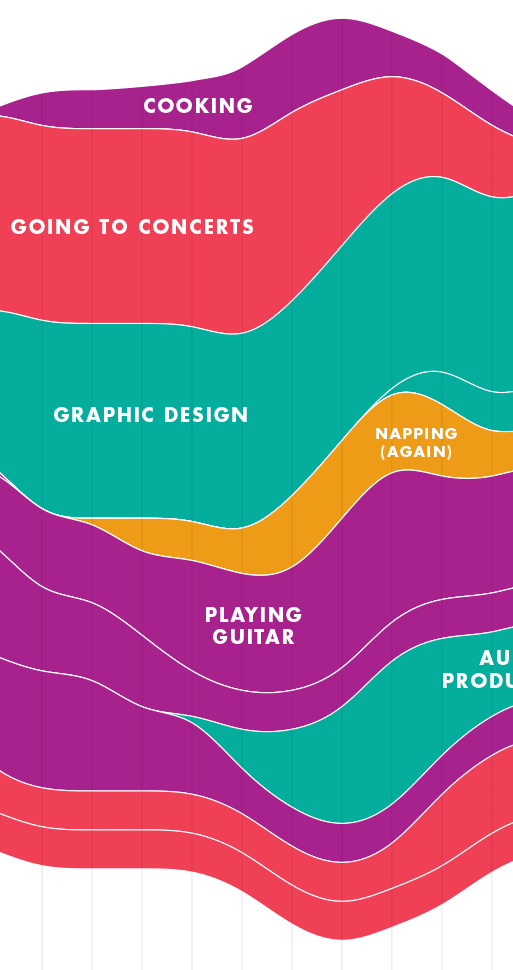
How I've spent my time
Alli Torban
February 2022
Spare time over a life time
Carni Klirs
February 2017
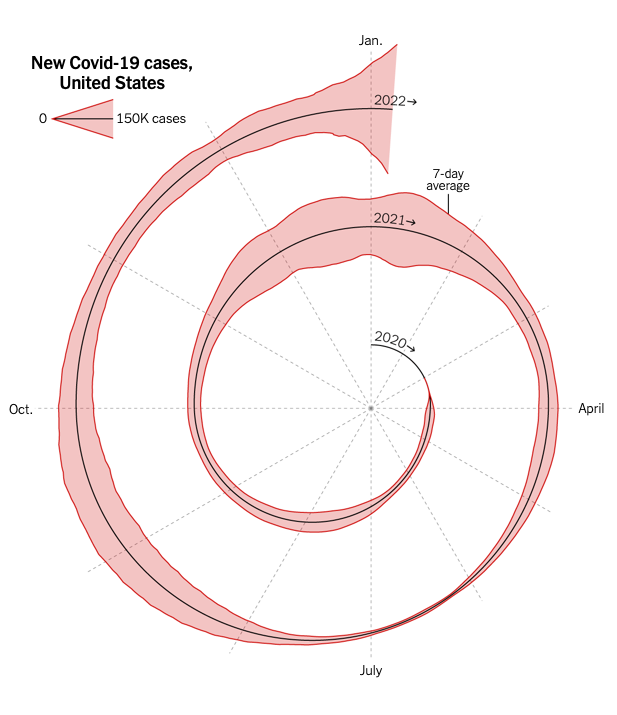
Here’s When We Expect Omicron to Peak
The New York Times
January 2022
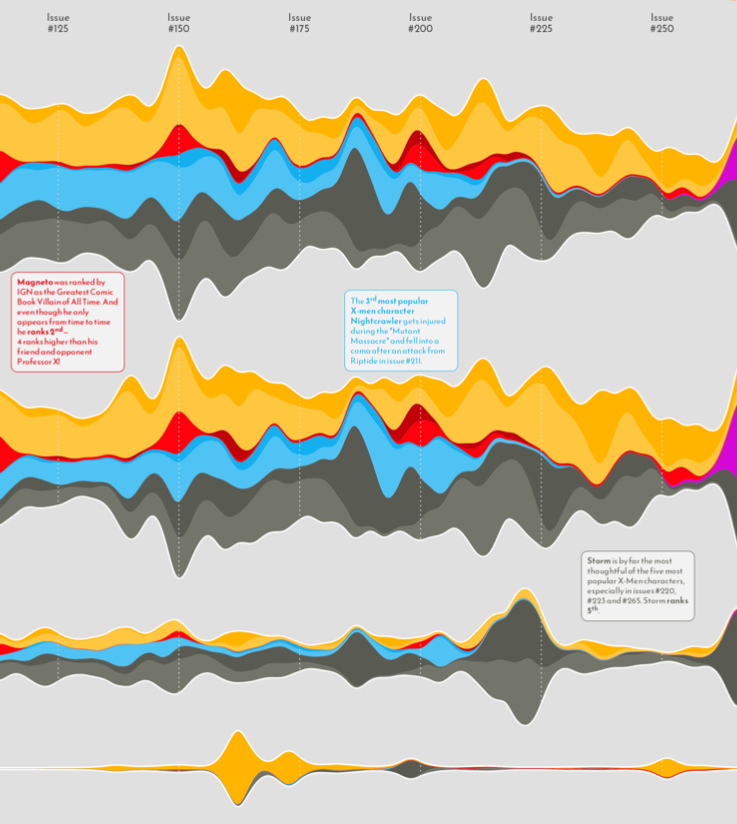
Appearance of the Five Most Popular X-Men Characters
Cédric Scherer
July 2020
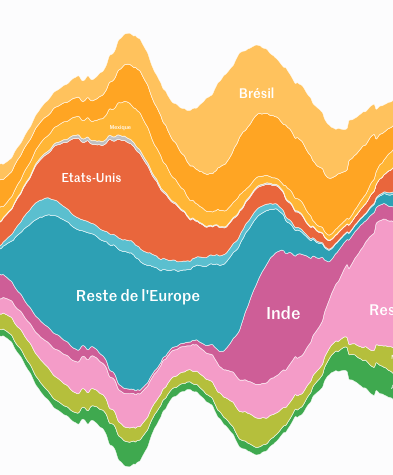
Covid dashboard
Le Monde
February 2021
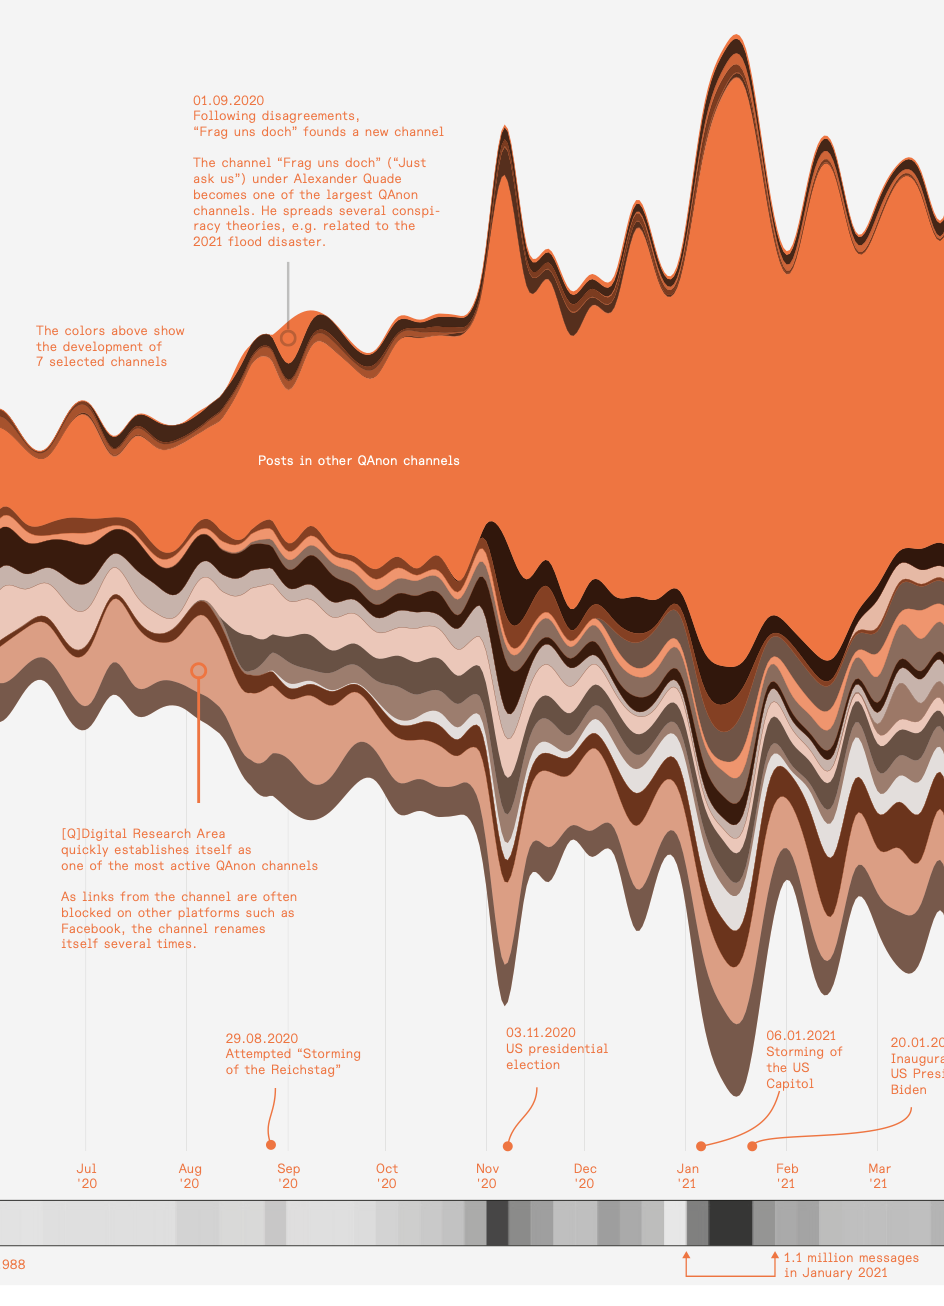
The Spread of QAnon
Cédric Scherer
March 2022